Drawing and Writing on Images using OpenCV
In this story we are going to go through some functions of OpenCV that can help us draw shapes and place texts on Images according to our will.
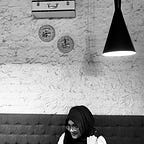
First things first, lets show this image using matplotlib in jupyter using the following code:
import cv2 as cv
import matplotlib.pyplot as pltimage1=cv.imread(“catto2.png”,1)
image2=cv.cvtColor(image1, cv.COLOR_BGR2RGB)
plt.imshow(image2)

If these steps seem unfamiliar , check out my previous blog
DRAWING RECTANGLES:
Method used for drawing Rectangles:
cv2.rectangle()
Syntax: cv2.rectangle(img, startingPoint, endingPoint, colour, thickness)
Example:
image3=cv.rectangle(image2,(40,40),(200,200),(0,0,0),10)
plt.imshow(image3)
Output for this code is :

Explanation:
Here we are drawing a black rectangle of dimensions (200,200) starting from co-ordinates(40,40) having a thickness of 10px.
DRAWING CIRCLES:
Method used for drawing Circles:
cv2.circle()
Syntax: cv2.circle(img, co-ordinates, radius, colour, thickness)


DRAWING LINES:
Method used for drawing Lines:
cv2.line()
Syntax: cv2.line(img, startingPoint, endingPoint, colour, thickness)


PLACING TEXTS ON IMAGES
The method for placing texts on images expects a lot of parameters, we’ll go over them all one by one.
Syntax:
image = cv2.putText(image, text, org, font, fontScale, color, thickness, lineType)
Parameter description:
image: The image to place a text on
text: The text to be placed on the image
org: The coordinates of the bottom-left corner of the text string in the image. The coordinates are represented as tuples of two values i.e. (X coordinate value, Y coordinate value).
font: The font family used for the text
fontScale: The font scale factor that is multiplied by the font-specific base size.
color: The color of the text
thickness: Thickness of the text
lineType: An optional parameter. It gives the type of the line to be used. Example : cv2.line_AA